Q&B Home Page
After you logged in, you should see the home page of the application.
On the left you will find a sidebar, which contains the name of your company and the following sections:
- Quotes – register, update and track the quotes. Also, it is possible to generate some documents from quotation.
- Policies – convert quotes to the policies and trace mid-term changes.
- Clients – create corporate or individual new clients, add their address and contact information if needed, review quotes/policies/invoices and documents that they are associated with.
- Finances – register financial invoices, produce documents and track invoice statuses, payments, statements, manage currencies.
- Underwriting – create/modify schemas, create workflows, create endorsements and separate them between libraries, define products and risks, also include system datasets, binders.
- Admin – register insurance sales process parties, see users permissions, create document and email templates, register and track activities in the diary.
- Data Exchange - export and import various data (available only for super users).
- Reports – register and view current reports, export them in various formats, view live report data on the platform.
The top bar has icons for User (to check which user is logged in), Notifications, Activities, and Create a Quote (to create a quote quickly).
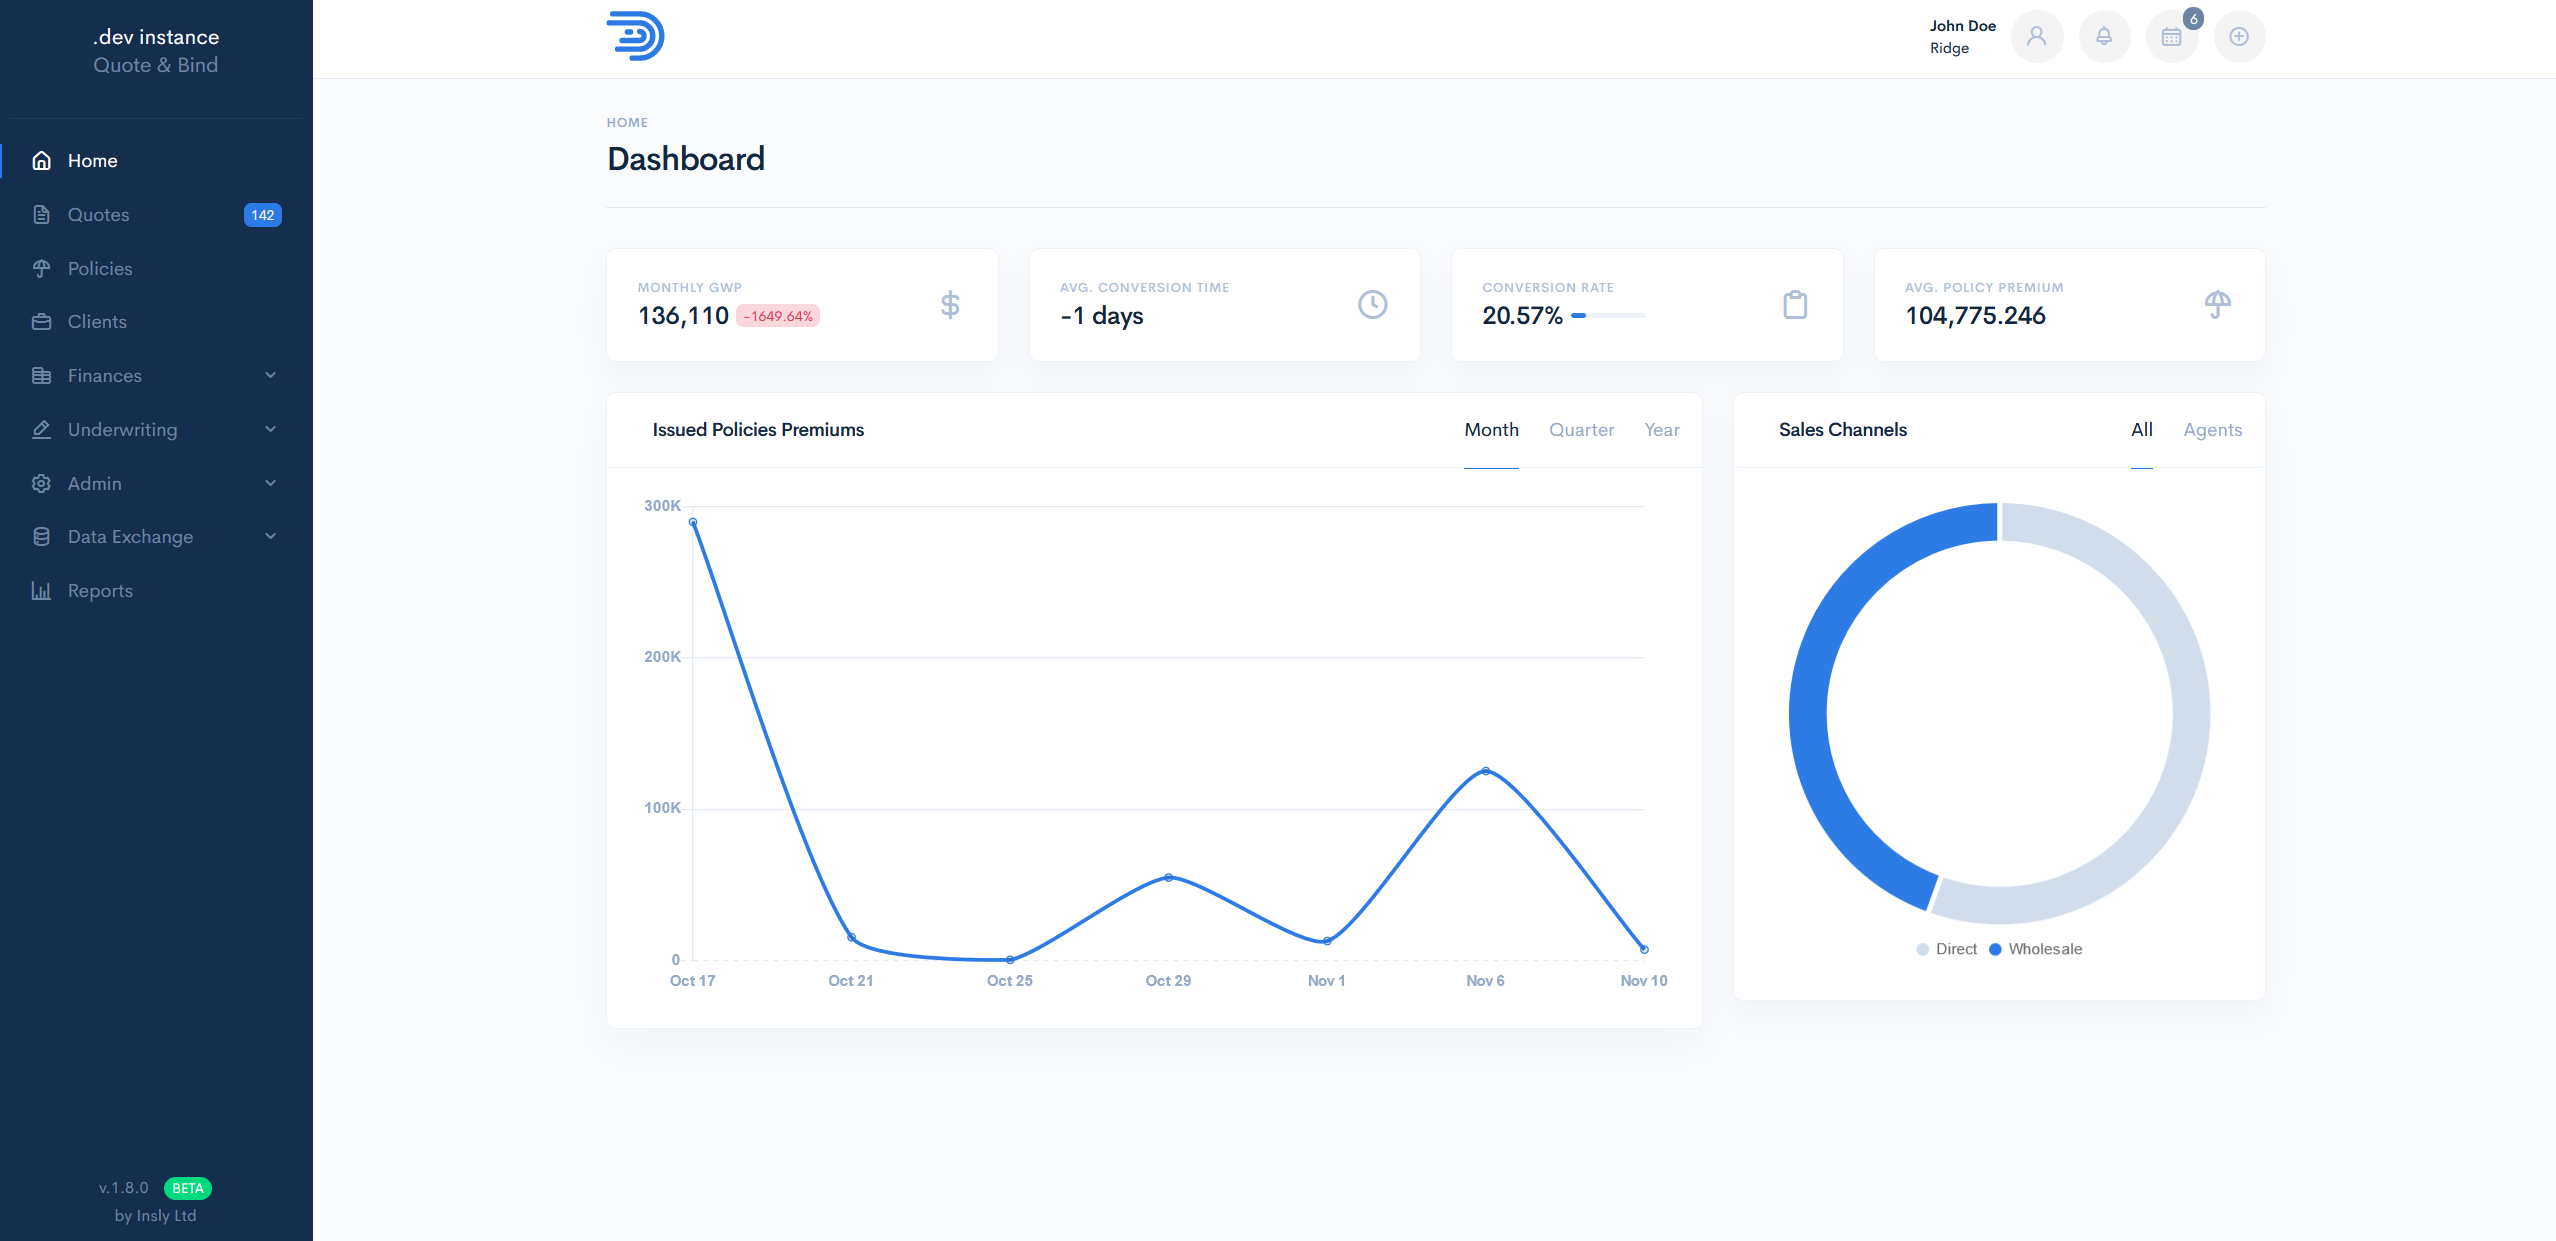
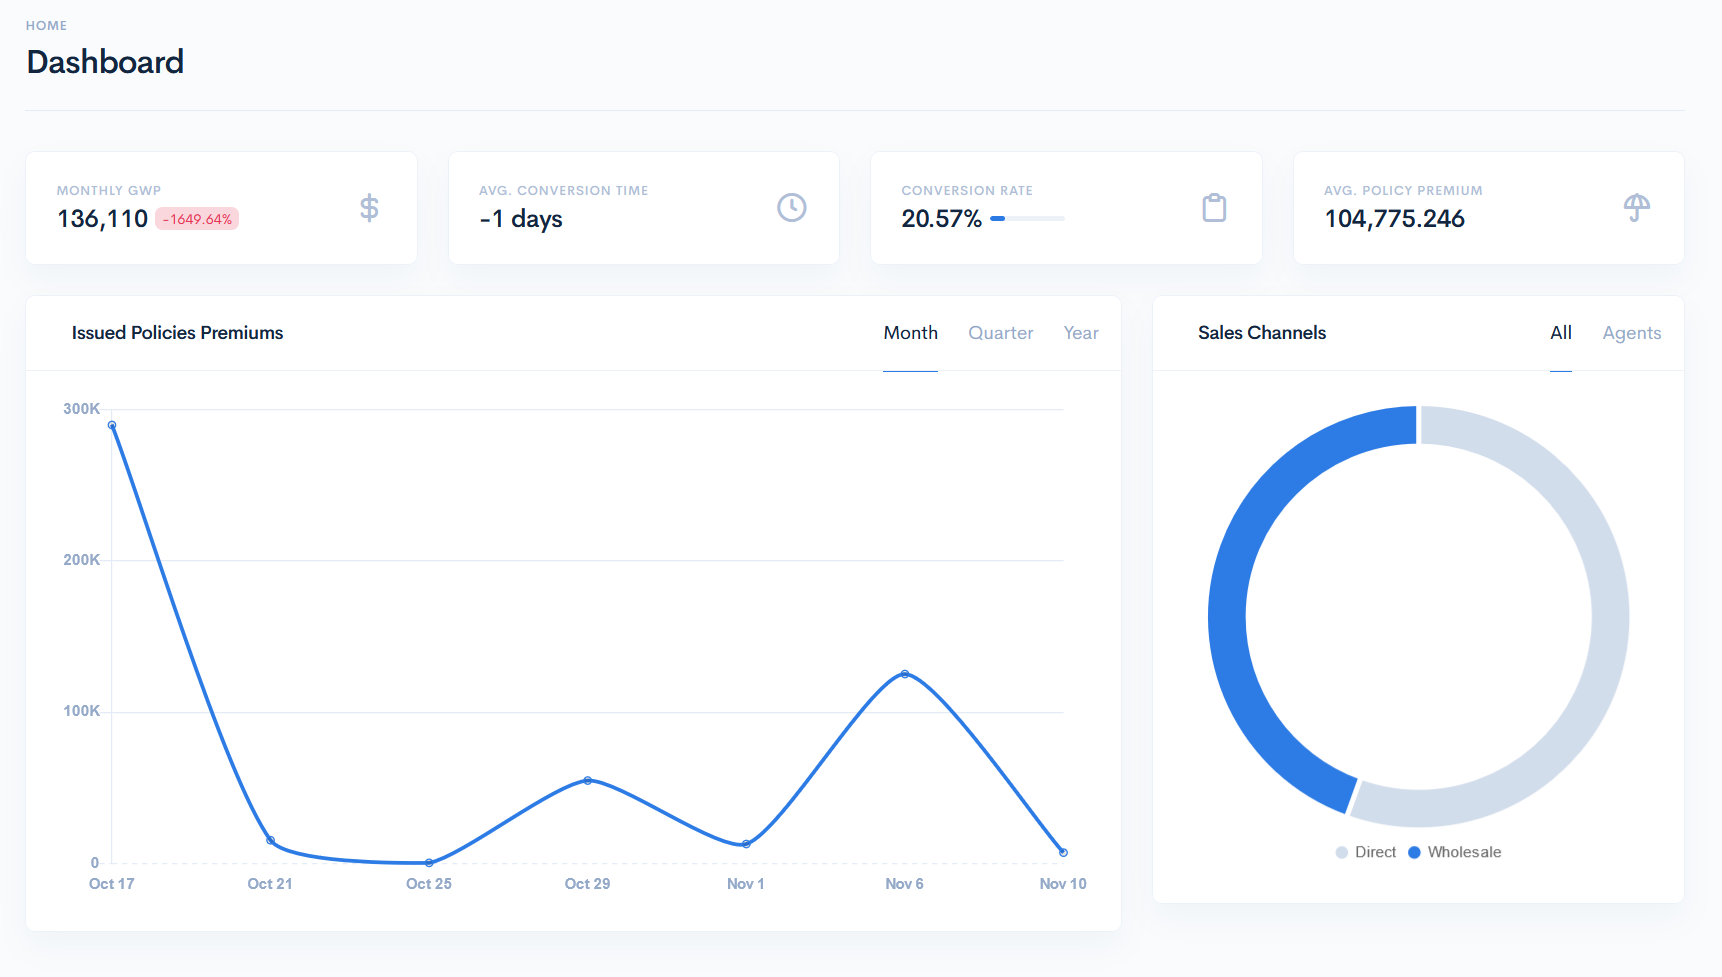
Dashboard
At the center of this page, there is a dashboard with various data regarding the sales situation. The following information blocks are available:
KPI Indicators:
- Monthly GWP - sum of premiums of all issued quotes. The difference from the last month's GWP in percent is shown next to the premium.
- Avg. Conversion Time - average of time in days between the policy issue and creation date.
- Conversion Rate - ratio between the issued and total quotes.
- Avg. Policy Premium - average sum of all issued policies.
The Issued Policies block displays a chart, where the X-axis shows dates and the Y-axis – the number of issued policies premiums. You can filter this by Month, Quarter and Year.
The Sales Channels block shows a doughnut chart.
In the All tab you will see the Direct (agent did not participate in the sale) versus Wholesale (the policy is sold through an agent) sales in percent.
If you click the Agents tab, the chart will convert to the agents breakdown - it will show their sales in percent. The system selects top 5 agents with most sales and the left are gathered into the Others group.
{info.fa-info-circle} Hover over the chart part to see the percentage.
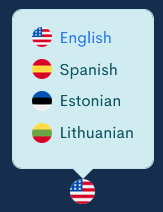
Select a Language
It is possible to change a language in the Q&B system. At the page bottom, hover over the country flag circle, which shows the current system language. Selection of langauges will appear. Click on the desirable option to instantly change the language.